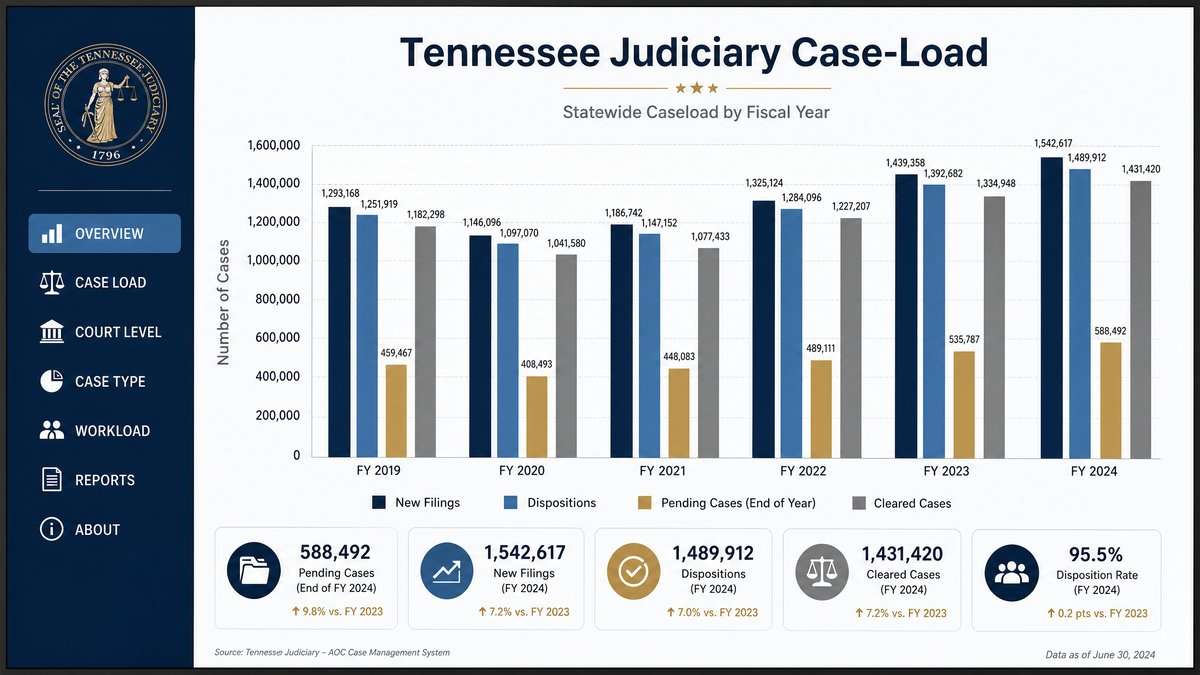
Annual statistical reports can look straightforward: a few charts, a handful of totals, and a short list of definitions. In practice, consistency is difficult. Headline numbers use specific labels. Different sections count different things. And without a repeatable method for extracting and documenting the figures, two readers can reach different totals from the same page. This article lays out a clear, step-by-step, reproducible way to read Tennessee Judiciary annual-report case-load figures using only the judiciary’s official publications.
Start with the source and name it precisely
Always begin by identifying the exact report you are using and saving a link to it. For Tennessee, the judiciary publishes annual statewide statistics in a single PDF. The current publication is the Official 2025 Tennessee Judiciary Annual Report, available here: Official 2025 Tennessee Judiciary Annual Report (PDF). When you cite or compare totals, record the report’s exact title as it appears on the PDF and keep the link with your notes. If you later revisit your work—or a reader asks for your method—you can retrace every step to the same page and the same line.

Know the unit of time: fiscal-year labeling controls
Annual statistics in Tennessee are organized by fiscal year, which is reflected in the report title and throughout its tables and charts. Use only the fiscal-year period shown in the document you are reading and avoid mixing figures from different years. If you need to compare across years, download each relevant PDF from the judiciary’s archive to ensure that like is compared with like. To locate reports across years, start from the judiciary’s central index: Tennessee Judiciary Statistical Reports page.
Download the video transcript (PDF).

Locate the case-load section you are quoting
Annual reports typically group the statewide judiciary by court level. Before you copy any figure, confirm which court’s case-load section you are in and keep your notes tied to that section. As an example, the 2025 report includes a Supreme Court case-load section that reports the following counts: 673 appeals filed, 673 finalized, 26 opinions, 673 orders, and a stated 100% clearance rate. These figures appear in the Supreme Court portion of the annual report: Supreme Court case-load figures in the 2025 report PDF. Each court level has its own workflow and labels. Pulling a “total filings” number from one court and a “total dispositions” number from another court will not show a meaningful rate or trend.
Read the labels exactly as printed
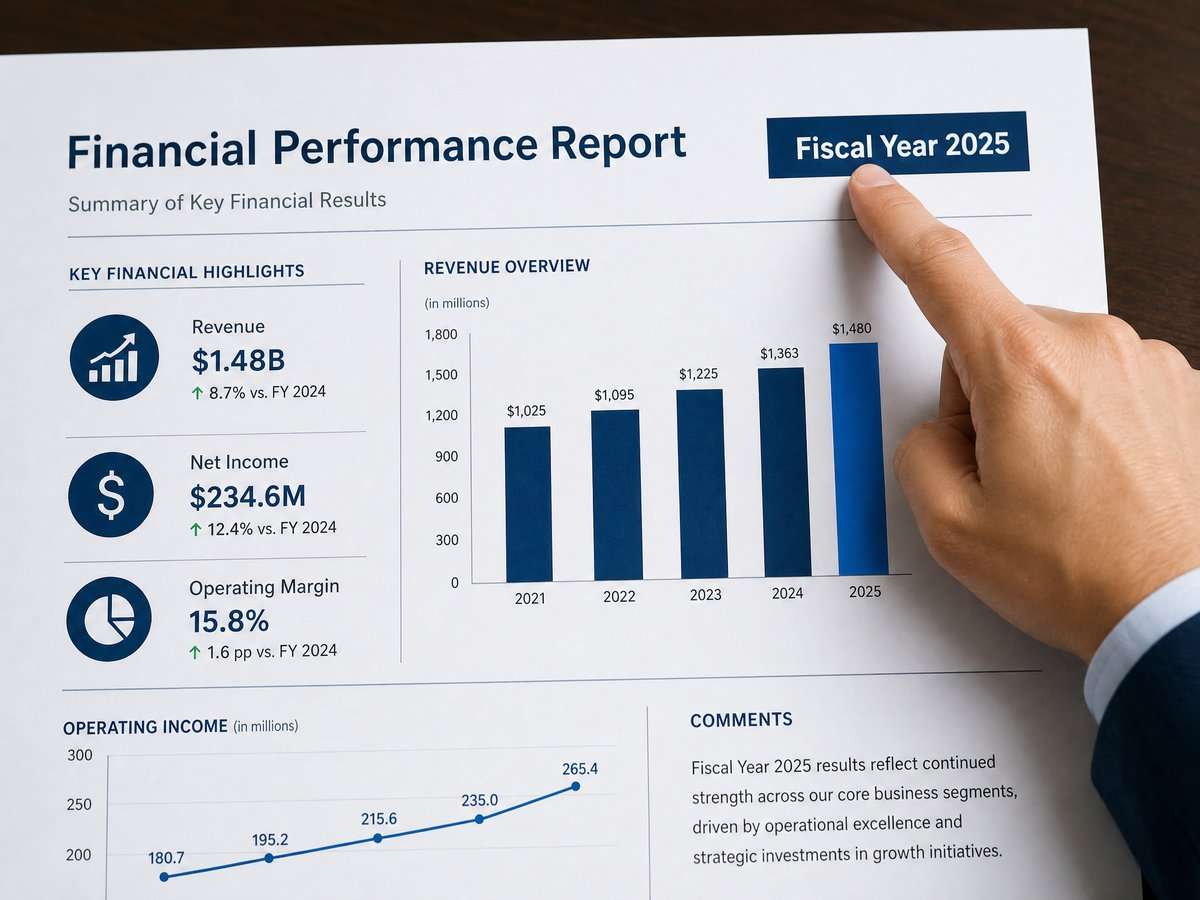
In statistical reports, seemingly similar terms can carry different meanings. The safest practice is to quote labels exactly and avoid substitutions. Common labels you will see include:
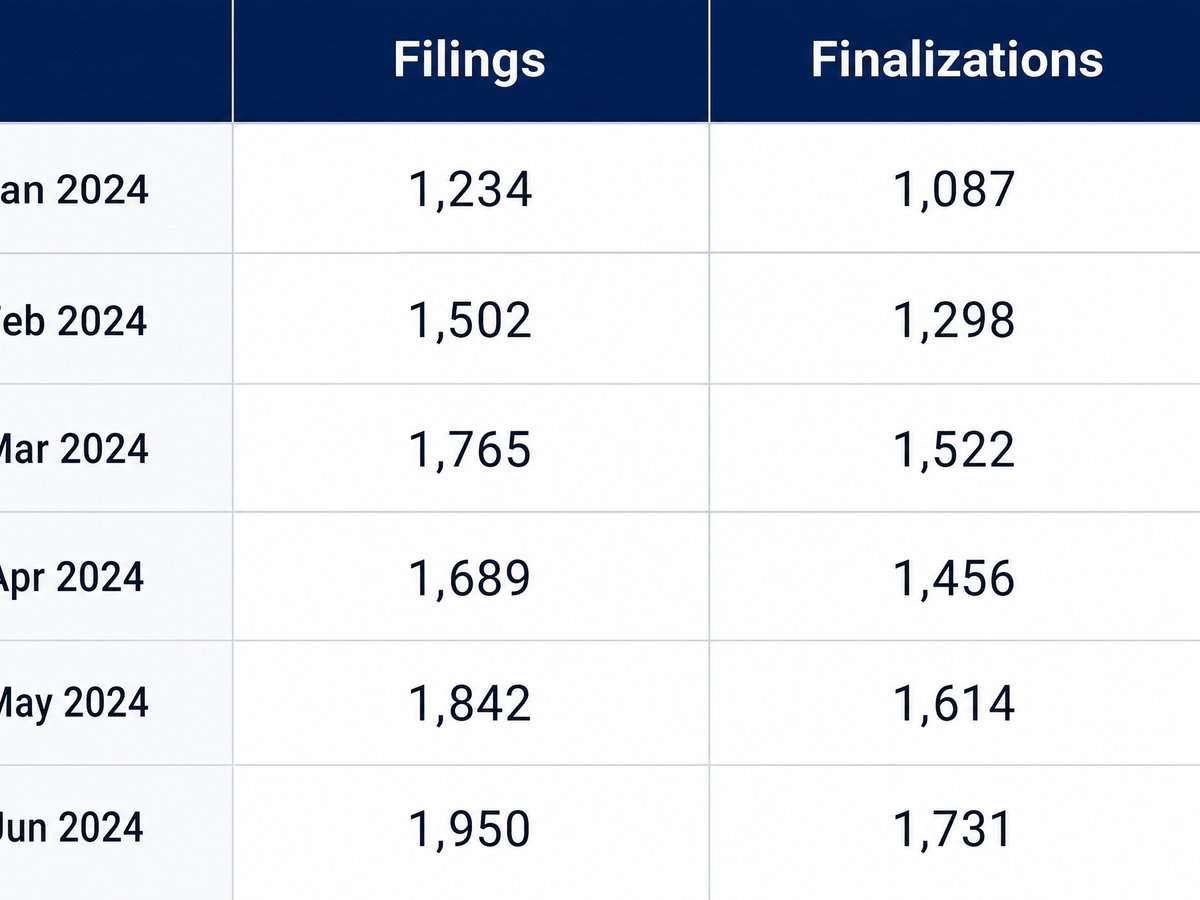
- Filed/Appeals filed: The count of appeals the court received during the fiscal year, as reported.
- Finalized/Dispositions: The count of appeals the court concluded during the fiscal year, as reported.
- Opinions: Appellate decisions issued as opinions.
- Orders: Appellate actions or rulings issued as orders.
- Clearance rate: A rate reported in some sections, often reflecting the relationship between concluded and incoming matters for the same period.
Do not assume that “finalized” is interchangeable with any other term unless the report does so. Use the report’s own wording for any figure you restate. In the Supreme Court example above, the section uses “appeals filed,” “finalized,” “opinions,” and “orders,” and it reports a “100% clearance rate.” Keep those words together with the court level and fiscal year in your notes.
Document the calculation you perform—and only after the labels are fixed
When the report provides both filings and finalizations (or filings and dispositions) for a court section, you can reproduce the clearance rate by dividing finalizations by filings for that same section and year. Using the Supreme Court example from the 2025 report’s case-load section: 673 finalized divided by 673 appeals filed yields a clearance rate of 100%. Because the report itself states a 100% clearance rate for that section, your independent calculation should match the report. If it does not, recheck your labels and confirm that you are staying within a single court section and the same fiscal year.
- Calculate within one court section at a time.
- Use figures from the same fiscal year.
- Do not combine “opinions” and “orders” to infer a new total unless the report does so.
- Prefer the report’s stated rate over any derived calculation if a difference appears, and recheck which labels you used.
Distinguish volume (filings, finalizations) from formats (opinions, orders)
Readers often equate the count of opinions with a court’s overall throughput. The annual report’s case-load sections help prevent that error by placing decision formats alongside volume measures. In the 2025 Supreme Court case-load section, the report lists 26 opinions for the year and 673 orders. The same section reports 673 appeals filed and 673 finalized. Read these as distinct counts based on the report’s labels. The counts show that orders appear more frequently than opinions in that section, while filings and finalizations align one-to-one for the period.
A step-by-step, reproducible workflow
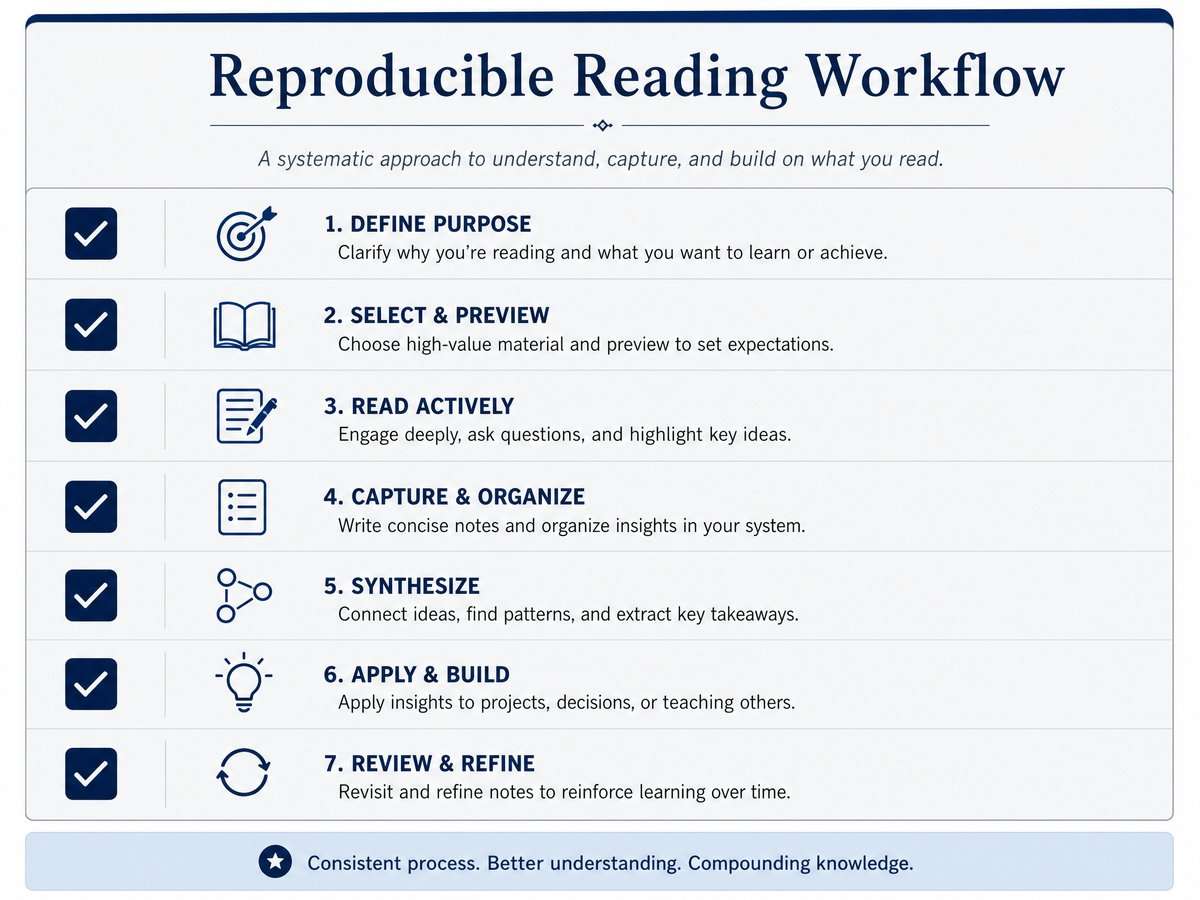
1) Retrieve the official PDF from the judiciary
Download the specific annual report you intend to cite and save the file name, title, and URL in your notes. The 2025 report is here: Official 2025 Tennessee Judiciary Annual Report download link.
2) Identify the court level before you collect any figure
Navigate to the section for the court you are studying. Note the section heading verbatim. Do not mix figures across court levels; compute any rate only within one level and within the same fiscal year. If you extract multiple sections, keep separate notes for each, labeled by court and page number.
3) Copy labels verbatim and track page location
For each figure you plan to cite, write down the exact label as printed and the page number. If the report uses “appeals filed” and “finalized,” use those phrases in your write-up. If it lists “opinions” and “orders,” keep them separate and do not assume one implies the other. When in doubt, re-read any definitions or footnotes accompanying the table you are using.
4) Record four distinct types of numbers where available
- Incoming: filings for the period (for example, “appeals filed”).
- Outgoing: concluded cases for the period (for example, “finalized”).
- Decision formats: opinions and orders, if listed for that court section.
- Any stated rates: such as the section’s clearance rate, if the report provides it.
For the Supreme Court section in the 2025 report, the four items appear together: filings (673), finalizations (673), opinions (26), orders (673), plus the stated 100% clearance rate. Your notes should keep those values aligned with the labels and court level for that same section.
5) Reproduce the clearance rate only after verifying scope
Once you confirm the scope (same court, same fiscal year, same labels), calculate the clearance rate by dividing finalizations by filings for that section. Cross-check your result with the report’s stated clearance rate if one is provided. Differences usually indicate that a label was misread, a figure was taken from a different section, or a formatting count (opinion/order) was mistakenly treated as a volume count.
6) Keep formats separate from outcomes
Opinions and orders describe how the court memorialized its action. They are not the same as filings or finalizations, and they do not substitute for volume measures. In the 2025 Supreme Court case-load section, the counts for opinions and orders exist alongside the filings and finalizations. Read each as a distinct measurement and avoid combining them unless the report itself adds them together for a stated purpose.
7) When comparing years, match sections and labels exactly
Year-over-year comparisons should be built from the same court sections using the same labels. Because the judiciary provides annual PDFs, the simplest way to standardize comparisons is to place the PDFs side by side and extract only those labels that appear in both. Always obtain each year’s document directly from the judiciary’s index so your links remain traceable and your references verifiable: Tennessee Judiciary statistical reports archive for multiple years.
Avoid common misreads
- Using calendar-year assumptions with a fiscal-year report. Stick to the fiscal-year labeling the report uses.
- Treating “opinions” as the total volume of cases. The annual report separates formats (opinions, orders) from volume (filings, finalizations).
- Mixing courts or court sections. Compute any rates and comparisons within the same court level.
- Adding categories that the report lists separately. If the report does not add them, do not create a combined total.
- Reading a stated rate without confirming the numerator and denominator. Match both to the labels the report uses for that court and year.
An example walk-through from the report
Suppose you want to report the Supreme Court’s case-load figures as presented in the 2025 annual report. A reproducible approach would look like this:
- Open the PDF: Official 2025 Tennessee Judiciary Annual Report (PDF).
- Navigate to the Supreme Court case-load section. Note the section title and page number in your notes.
- Copy the labels and numbers as printed in that section: appeals filed (673), finalized (673), opinions (26), orders (673), and the stated clearance rate (100%).
- State each figure with its label and court level, citing the report. If you include a clearance rate, use the report’s stated rate or reproduce it by dividing 673 finalized by 673 appeals filed.
- Keep opinions and orders separate from filings and finalizations in any narrative you publish.
This procedure allows another reader to open the same document, find the same section, and confirm that your figures and labels match the source.
What the report does—and does not—explain
The annual report provides counts and, in some sections, rates. It is designed to show what happened numerically during the fiscal year, not to explain why those numbers changed. When you discuss changes across years, avoid attributing causes unless the report itself does so. Keep your commentary tied to what the official publication reports and clearly separate your observations from the document’s stated figures.
How to present your findings for verification
To make your work reproducible by others, present your notes and citations with enough detail that a reader can replicate your steps:
- Include the full report title and a working link to the PDF.
- List the court section, the exact labels, the figures, and the page on which they appear.
- If you perform a calculation, show the formula using the labels (for example, “clearance rate = finalized ÷ appeals filed”).
- Provide a link to the judiciary’s statistical reports index so readers can find other years for context.
A compact checklist you can reuse
- Source: Download the correct fiscal-year PDF from the judiciary’s site.
- Scope: Identify the court level and stay within that section.
- Labels: Copy terms exactly as printed (filed, finalized, opinions, orders, clearance rate).
- Extraction: Record each figure with its label and page number.
- Calculation: Compute rates within the same section and year; confirm against any rate the report states.
- Separation: Do not mix volume measures with format counts.
- Comparison: If comparing years, match sections and labels one-to-one, retrieving each year from the official archive.
- Caveat: Describe observed changes without assigning causes the report does not provide.
Why this method aligns with public-record best practices
Official court statistical reports are public records designed for consistent reference. A reader-centered approach treats the report’s labels as authoritative, avoids mixing categories, and favors transparency about sources and calculations. By linking directly to the Tennessee Judiciary’s annual report and its statistical reports index, and by quoting the report’s own labels and figures for the Supreme Court case-load section, you give readers the means to check your work against the same official document.
Where to go next
If you are building a series on Tennessee’s appellate case loads, repeat the steps above for each fiscal year’s report obtained from the judiciary’s index. For each year, isolate the court section you need, copy the labels and numbers as printed, and document any calculation you make. As the 2025 annual report’s Supreme Court section shows—reporting 673 appeals filed, 673 finalized, 26 opinions, 673 orders, and a 100% clearance rate—the method scales from one section to many as long as you keep the scope and labels precise within each section of the official report.
Sources
This article provides general information, not legal advice. Court rules, records, and legal consequences depend on the facts, the forum, and current law; consult a qualified lawyer for advice about a specific situation.
General-information disclaimer: This article is provided for journalism and general information only. It is not legal advice and does not create an attorney-client relationship.
Leave a Reply